US Department of Labor
Occupational Safety and Health Administration

OSHA Enforcement: Committed to Safe and Healthful Workplaces
Under the Occupational Safety and Health Act of 1970, OSHA's role is to assure safe and healthful conditions for working men and women. OSHA does so by enforcing the standards developed under the Act; by assisting and encouraging the States in their efforts to assure safe and healthful working conditions; by providing research, information, education, and training in the field of occupational safety and health.
OSHA is committed to establishing up-to-date workplace safety and health regulations based on strong science, emphasizing fair enforcement of standards, and making prevention a priority. OSHA will continue to strive to make jobs safe for everyone with the goal of having employers plan, prevent, and protect their workers every single day.
Severe Violator Enforcement Program (SVEP): New Program began in June 2010
The SVEP directive became effective on June 18, 2010, cancelling the Enhanced Enforcement Program. Under the SVEP, the criteria was changed to better focus enforcement efforts on significant hazards by concentrating inspection resources on employers who have demonstrated recalcitrance or indifference to their OSH Act obligations by committing willful, repeated, or failure-to-abate violations in one or more of the following circumstances: (1) a fatality or catastrophe situation; (2) in industry operations or processes that expose employees to the most severe occupational hazards and those identified as "High-Emphasis Hazards;" (3) exposing employees to hazards related to the potential release of a highly hazardous chemical; or (4) all egregious enforcement actions. The SVEP also created a nationwide referral procedure in which OSHA may inspect related worksites/workplaces of a SVEP employer if OSHA identifies a broader pattern of non-compliance. The High-Emphasis Hazards include fall hazards and specific hazards identified from the following selected National Emphasis Programs1:
- Amputations;
- Combustible dust;
- Crystalline silica;
- Excavation/trenching;
- Lead; and
- Shipbreaking.
OSHA Changes Penalty Structure:
On April 22, 2010, OSHA announced it would be making several administrative changes to its existing penalty policy. In summary, the changes impact the way OSHA applies penalty adjustment factors when calculating the proposed penalty. Administrative enhancements were made to the following factors: employer size, history, repeated violations, severe violator enforcement program, good faith, gravity-based penalties, minimum penalties and application of the penalty calculation. These changes were piloted throughout the summer and became effective in all Federal OSHA offices on October 1, 2010.
Injury and Illness Rates: Record Lows Continue for CY 2009
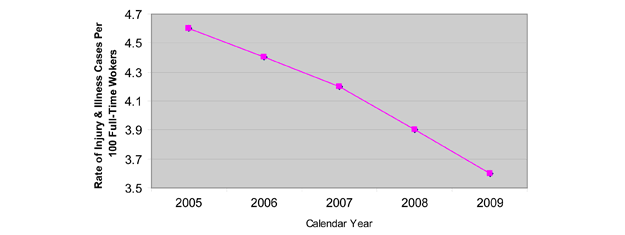
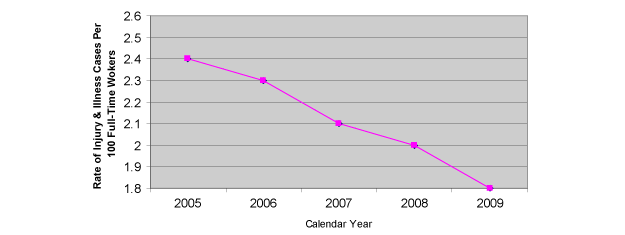
In CY 2009, the Total Recordable and Days Away, Restricted, or Job Transferred (DART) rates continued to decline, indicating that fewer American employees encountered safety or health hazards resulting in serious injuries or illnesses. The rates for calendar year 2009, reported on October 21, 2010, are the lowest rates that BLS has ever reported. Not only has the rate at which employees experienced a recordable injury decreased by 22% since calendar year 2005, but also the DART rate, the measure of cases in which employees were absent from work, restricted, or job transferred, as a result of a workplace injury or illness, has declined by 25% over the same period.
Total Recordable Case Rate (TRCR)

| Injury and Illness Rates2, 3 | 2005 | 2006 | 2007 | 2008 | 2009 | % Reduction 2005-2009 |
| Total Recordable Case Rate | 4.6 | 4.4 | 4.2 | 3.9 | 3.6 | -22% |
| Days Away/Restricted Case Rate | 2.4 | 2.3 | 2.1 | 2.0 | 1.8 | -25% |
Days Away/Restricted Case Rate

Workplace Fatality Rates: Rates at Record Lows


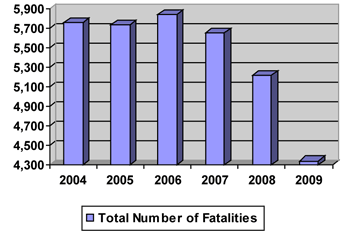
OSHA continues to aggressively pursue the reduction of workplace fatalities. In calendar year 2009, a total of 4,340 fatal work injuries were recorded in the United States, down from a total of 5,214 fatal work injuries reported for 2008. Additionally, the rate of fatal work injuries was 3.3 fatalities per 100,000 full-time equivalent workers, down from 3.7 the previous year. This preliminary data not only represents the smallest annual preliminary totals, but also signifies the largest decrease in fatalities since the Census of Fatal Occupational Injuries program was first conducted in 1992. However, it should be noted that economic factors played a major role in the fatal work injury decrease in 2009.
OSHA continues to enhance its efforts to reach at-risk Hispanic employees with targeted initiatives that include Spanish-language publications available in print and on OSHA's website, along with other compliance assistance information. Additionally, OSHA's Local Emphasis Programs (LEPs) target industries in which Hispanic employees are significantly represented. As a result, the fatality rate for Hispanic workers has decreased by 26% since 2004.
| Fatality Statistics | 2004 | 2005 | 2006 | 2007 | 2008 | 2009* |
| Total Number of Fatalities | 5,764 | 5,734 | 5,840 | 5,657 | 5,214 | 4,340 |
| Fatality Rate4 | 4.1 | 4.0 | 4.0 | 4.0 | 3.7 | 3.3 |
| Hispanic Fatality Rate4 | 5.0 | 4.9 | 5.0 | 4.6 | 4.0 | 3.7 |
Referrals or Significant Aid to Prosecutors Addressing OSHA-Related Matters
| 2007 | 2008 | 2009 | 2010 | |
| Criminal Referrals | 10 | 14 | 11 | 145 |
These actions include referrals under Title 29 of the United States Code, Section 666(e), for employee deaths caused by willful conduct violating an OSHA standard, obstruction of justice, state and local investigations and prosecutions, and fraud related to other OSHA matters, such as training verification.
OSHA Inspection Activity Remains Vigorous and Proactive
OSHA continued to maintain its high level of annual inspection activity. In FY 2010, OSHA conducted 40,993 total inspections. This number includes 164 significant and egregious (instance-by-instance) enforcement actions, each resulting in a total proposed monetary penalty of more than $100,000. In addition, OSHA conducted 24,759 programmed inspections. These inspections indicate that OSHA devoted more resources to proactively target the industries and employers that experienced the greatest number of workplace injuries and illnesses. OSHA also conducted 16,234 unprogrammed inspections, including employee complaints, accidents, and referrals. The number of fatality investigations decreased by 25.6%- a significant decrease over the past five fiscal years, thus demonstrating OSHA's firm commitment to reducing the number of workplace fatalities.
Hazards Identified: Total Violations Increase
| OSHA Inspection Statistics | FY2006 | FY2007 | FY2008 | FY2009 | FY2010 | %Change 2006-2010 |
| Total Inspection | 38,579 | 39,324 | 38,667 | 39,004 | 40,993 | 6.2% |
| Total Programmed Inspections | 21,506 | 23,035 | 23,041 | 24,316 | 24,759 | 15.1% |
| Total Unprogrammed Inspections | 17,073 | 16,289 | 15,626 | 14,688 | 16,234 | -4.9% |
| Fatality Investigations | 1,081 | 1,043 | 936 | 797 | 804 | -25.6% |
| Complaints | 7,376 | 7,055 | 6,708 | 6,661 | 8,027 | 8.8% |
| Referrals | 5,019 | 5,007 | 4,880 | 4,375 | 4,634 | -7.7% |
| Other | 3,597 | 3,184 | 3,102 | 2,855 | 3,559 | -1.1% |
In FY 2010, OSHA found 96,742 violations of OSHA's standards and regulations in the nation's workplaces, a 15.3% increase since FY 2006. The total number of serious and repeat violations issued increased by 22.1% and 8.1%, respectively, over the past five years. The total number of willful violations issued significantly increased by 217.1% since FY 2006 and increased by 278.8% since FY 2009.
These numbers demonstrate that OSHA is identifying and eliminating more serious hazards in the workplace, as well as identifying more employers who have intentionally violated OSHA standards and ignored their duty to provide a safe and healthful workplace under the OSH Act.
| OSHA Violation Statistics | FY2006 | FY2007 | FY2008 | FY2009 | FY2010 | %Change 2006-2010 |
| Total Violations | 83,913 | 88,846 | 87,687 | 87,663 | 96,742 | 15.3% |
| Total Serious Violations | 61,337 | 67,176 | 67,052 | 67,668 | 74,885 | 22.1% |
| Total Willful Violations | 479 | 415 | 517 | 401 | 1,519 | 217.1%6 |
| Total Repeat Violations | 2,551 | 2,714 | 2,817 | 2,762 | 2,758 | 8.1% |
| Total Other-than-Serious | 19,246 | 18.,331 | 17,131 | 16,615 | 17,244 | -10.4% |
Protecting Whistleblowers: Integral to OSHA's Mission
Section 11(c) of the Act prohibits retaliation, in any manner, against employees who exercise their rights under the Act. These rights include complaining to OSHA and seeking an OSHA inspection, participating in an OSHA inspection, and participating or testifying in any proceeding related to an OSHA inspection. By protecting workers against retaliation for engaging in these activities, section 11(c) is essential to OSHA's core mission. In FY 2010, OSHA completed 1,177 section 11(c) investigations, and the 27 State programs completed 1,039 investigations.
Summary
OSHA's enforcement efforts remain vital to workplace safety and health by targeting the most hazardous workplaces and the employers that have the highest injury and illness rates. Innovative approaches, such as the SVEP, enable OSHA to effectively identify serious safety and health hazards, to address recalcitrant employers, and to efficiently use its resources. OSHA's continual focus on its mission to reduce workplace injuries, illnesses, and fatalities will enable OSHA to help make good jobs, safe jobs.
1Grain handling has been identified for future inclusion in the SVEP as a High-Emphasis Hazard. [back to text]
2Rates reflect number of cases per 100 full-time equivalent workers [back to text]
3Rates are for private industry employers [back to text]
4Rates reflect number of fatalities per 100 full-time employees [back to text]
5This number includes cases in which OSHA and SOL aided the U.S. Attorney, DOL-OIG and NY Department of Investigations (DOI) in addressing fraudulent training. [back to text]
6The significant increase over previous fiscal years is partly attributed to the large number of willful violations that were issued to BP North America and BP Huskey in FY 2010. [back to text]

